Important: UK Weekly Report Data WAS Demonstrably WRONG
It literally didn't add up

EDIT: It has been fixed. I’ll reimport the data now. I will leave the post as an example of how to sanity check data.
This is going to be a little different - I think I can make some assumptions and run the analysis but it’s going to take more work. In the meantime - if you run into any people talking about the UK data showing a “turnaround” be VERY wary.
I am going to assume there is an unintentional error here as this data has been extremely consistent. I suspect that perhaps they internally have a boosted column or two now, but they didn’t get put into the report (or we did get the boosted column but it’s labelled the 2 Dose column, that actually seems pretty consistent with what I’m seeing.)
But basically, for the first time EVER - 25-28% of cases/admissions/mortality is missing and it appears that it MUST be missing from the 2 Dose vaccinated column.
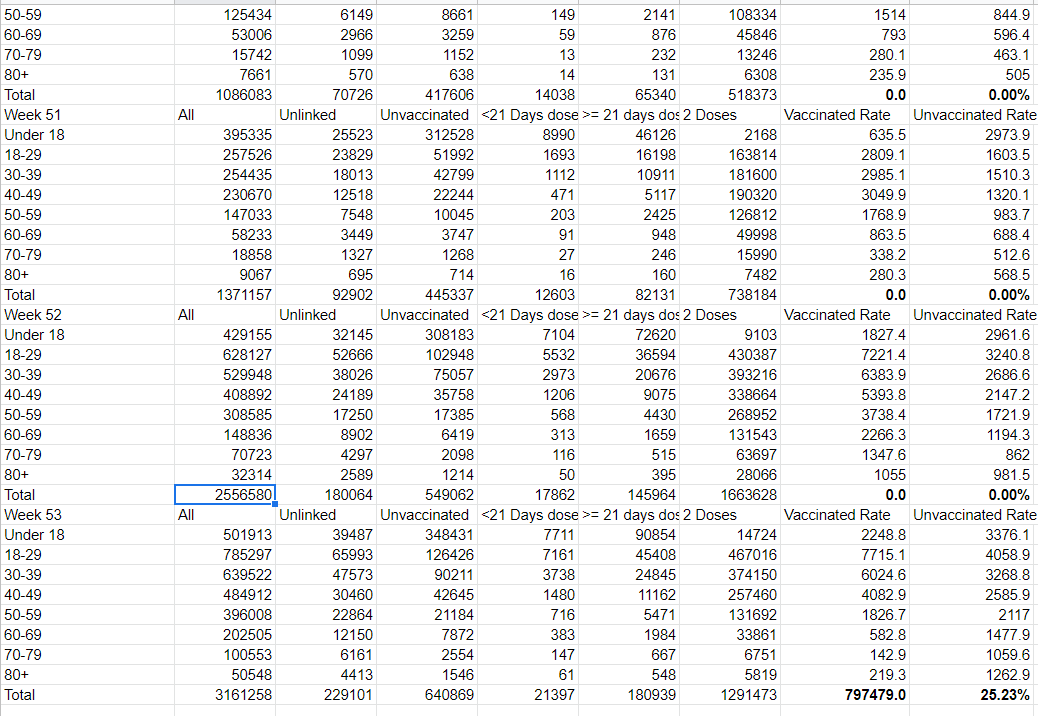
This is my initial step of data import. I have sheets for cases (here), admissions, and 28 day mortality. Numbers in bold are the All column (second from left) minus the sum of the other case columns. This is the ONLY week that this column is not 0. I can’t show you all my weeks on this screenshot, but every other one balances out. (I just added these calculations here today so forgive the bad column label.)
Yes, there are 797,479 cases missing. So the obvious question is WHERE are they missing? Well based on how this data is presented, the only place they CAN be missing is from the 2 Dose column. Why do I say that? Because these are sliding windows of data, 4 weeks at a time. It is literally impossible for a particular value (say the number of cases 70-79 years old, fully vaccinated) to go from 15990→63697→6751 over 3 weeks. The change from 15990 to 63697 only requires a very large influx of cases which Omicron provides. The problem is that we know that all four weeks added together the week before was 15990. So Weeks 47, 48, 49, and 50 which make up report 51 add up to 15990 cases. Week 52 sees a total of 63697 after adding week 51 and removing week 47. Let’s imagine the absolute worst case for week 53 which is that week 48 had all 15990 cases. We know this isn’t true, but it’s the worst case. That would mean that week 51 had 47,707 cases in it. Now in the new report week 48 rolls off and week 52 rolls on. We have a floor of 47,707 cases this week. There cannot be fewer even if week 52 has zero cases as well.
Any positive number of cases and any situation where week 48 had fewer than 15,990 cases means that we would have MORE than 47,707 - that’s the absolute floor. And yet we see 6751 cases in that spot.
The same thing happens when we look at Admissions

and Mortality
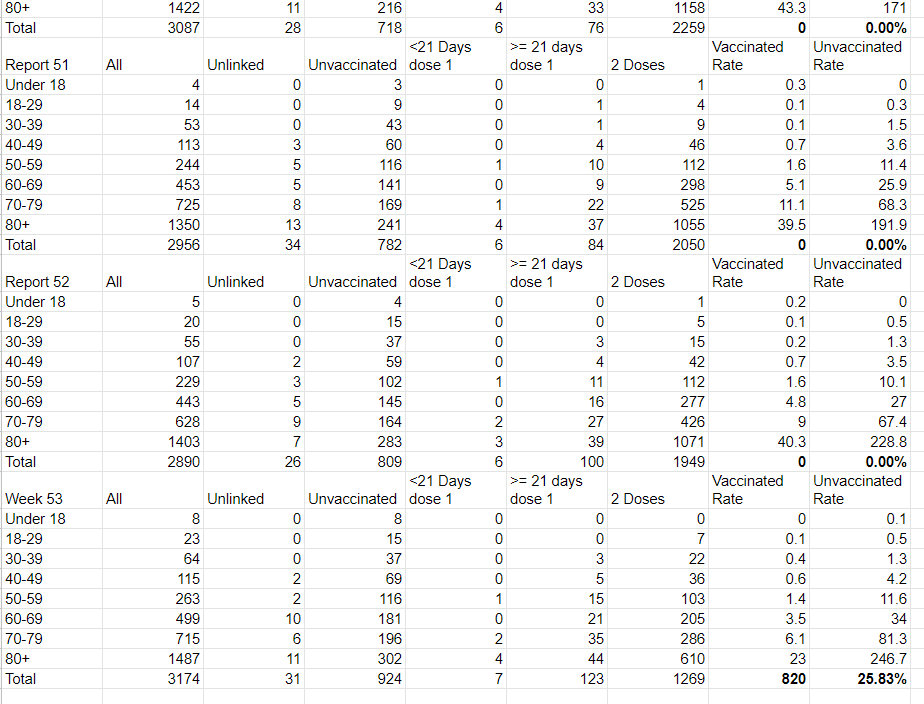
With the same implausible/impossible drops in the 2 Doses column. (The mortality column is actually possible though very improbable I think - it isn’t as clearly wrong).
I am going to work on correcting the data by assuming that 2 Doses is now the Boosted column and the missing numbers are the 2 Dose numbers, but that is going to take some time and coding which I don’t have at the moment.
But beware bad data and please share this with everyone so they can be aware that these numbers are currently untrustworthy.
Interesting, I wonder if their trying to suppress , delay and hide the info?