
It Might Be Time to Say OAS Out Loud
It Might Be Time to Say OAS Out Loud
Multiple sources are pointing at Antigenic Fixing

UPDATE - Longtime reader (and commentor) ForkInSocket points out that the Unvaccinated are much more likely to be subjected to regular asymptomatic testing for work. This would necessarily skew their results to less positivity. Walgreens also indicated that the vaccinated were more likely to get tested after known exposure and travel. This could all be the same issue - much less surveillance testing of the vaccinated. This greatly weakens the Walgreens evidence in support of OAS. It would be nice if they could break out asymptomatic work testing from these numbers.
First - a quick note - I do have some data I’m working with, but I was on a wonderful vacation last week and I’ve been catching up at my day job and fighting off the cold I caught this week (I did an antigen test yesterday, it’s just a cold). But I saw some interesting stuff and thought you fine people deserve an update.
Longtime readers will know that I’ve been extremely hesitant to go full bore down the Original Antigenic Sin (OAS) rabbit hole. While I’ve long acknowledged that it is a possibility, I’ve seen other options as being similarly possible (both being possible as well). The data that has come out in the past couple of weeks has definitely shifted my thinking.
First - let’s talk about the Walgreen’s data. Everyone wants to talk about the “Percentage of positive tests” but that’s subject to effectively a base-rate fallacy - how often are people getting tested. It turns out the other mode of that same page has this information. I don’t see a lot of people talking about this chart so I thought I would.
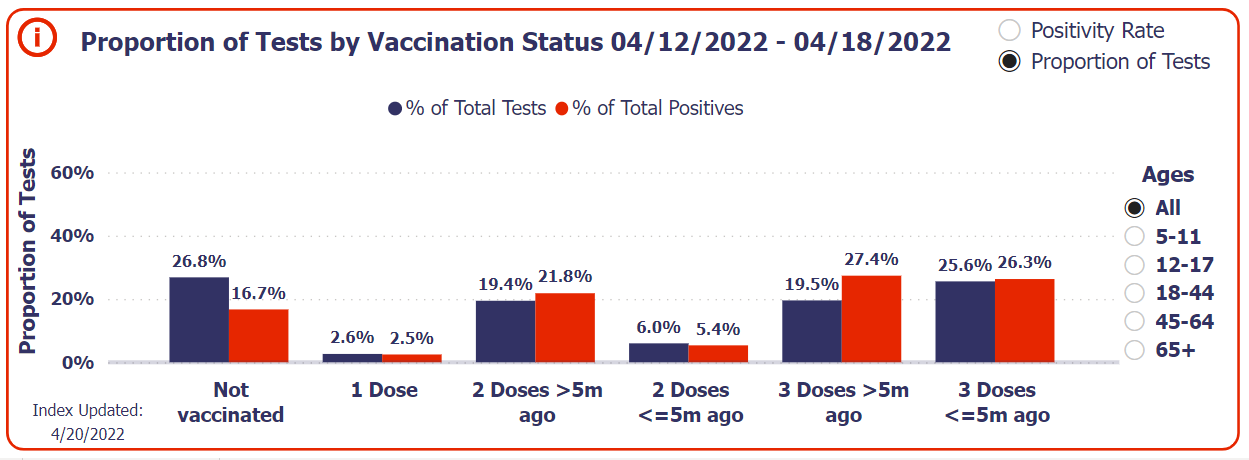
So in this chart, if vaccines are working, we would expect that the red/orange bar would be SHORTER than the blue/purple bar for the vaccinated categories. Put bluntly, they are not. At best they are slightly below (2 Doses <= 5m ago) at worst, they are significantly elevated (3 Doses > 5m ago). While 2 Doses <= 5m ago shows a 10% lower positivity percentage, 3 Doses >5m ago shows more than a 40% excess.
This chart also shows that contrary to popular belief, the highest percentage of testing is being done in the “Not vaccinated”. (Which is showing a 38% lower percentage of all positives).
Now this chart is all ages, which is ripe for Simpson’s paradox. Fortunately they give us some reasonable age groupings. Not as granular as we are used to, but still useful.
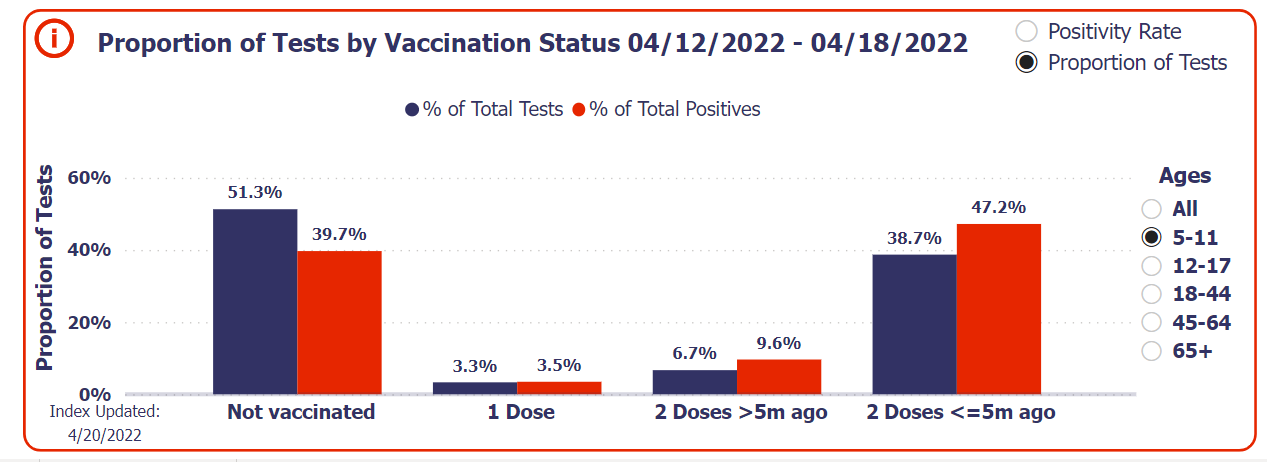
Here we don’t have boosters (they aren’t approved in this age) but we see the same picture. Interestingly the 2 Doses >5m cohort is over 43% over-represented in positives and <= 5m ago is just under 22% overrepresented.

This is the first chart showing any efficacy from shots and it’s very very small - unless you are 2 Doses >5m ago and then we see the very familiar ~40% over-representation (39.2%).
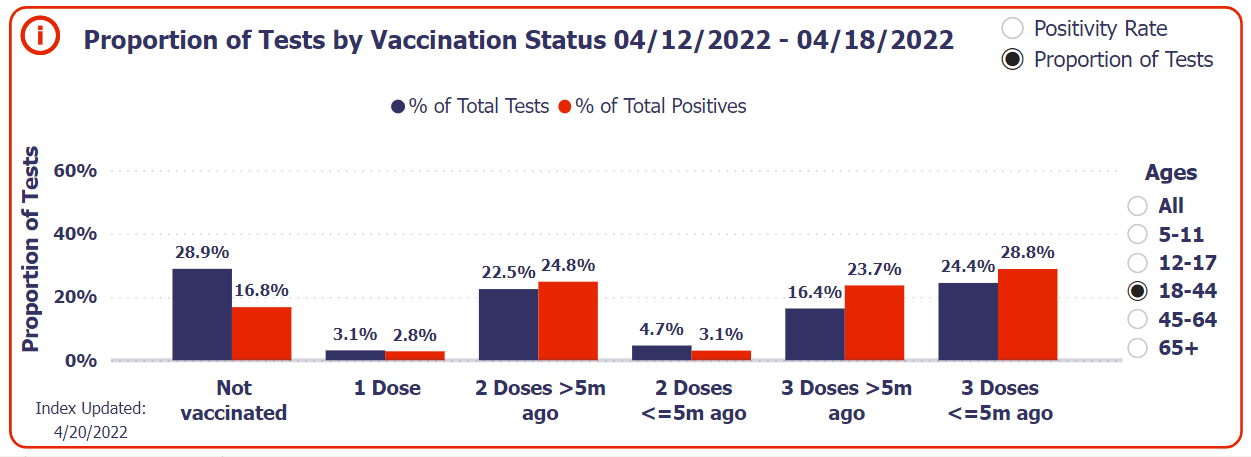
Interestingly in 18-44 year-olds, the minor benefit of being recently boosted disappears.

It returns here, but is again, VERY small.

And here it seems somewhat oversized. I suspect this might be due to the boosting skewing much earlier, so far fewer people are recent boosts. Their percentage of all tests is similar though.
So what do I see here? Well I see that despite having relatively high testing percentages overall, the unvaccinated are under-represented in the percentage of positives in ALL age groups. The declining percentages are reasonable proxies to their percentage of the population as a whole (they do seem slightly under sampled to their overall US population size, but the trend moves in the right direction with lower and lower percentages of total tests as the age groups get older.
I also see that as you stretch out timeframes, the percentages of postives gets closer and closer to even. The 2 Doses >5m for those 65+ is roughly a year ago. That shows a slight under-representation. But for 5-17 year-olds that is a much more recent event and we see over-representation.
And then we look at this week’s UK chart on VE against Symptomatic Disease with Pfizer.
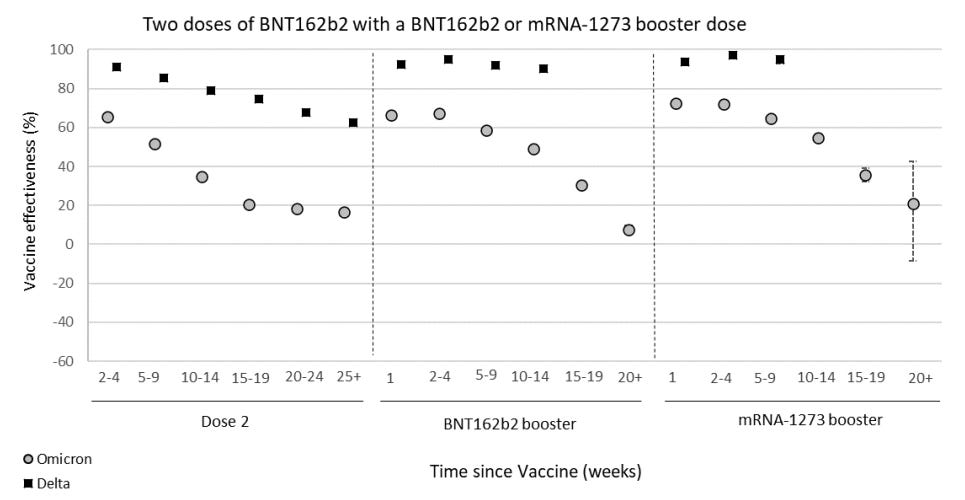
Do you see it? The 2 Doses VE levels out at a rather abysmal level just under 20%, but the BOOSTER VE falls to almost zero 20+ weeks out. (The Moderna booster has very wide error bars due to low numbers I assume, but those error bars include 0.
What does this imply? It implies that being >5m but relatively close to your last dose is a NET NEGATIVE to your viral protection. And having MORE doses makes that worse.
The 1 Dose cohorts in the Walgreens data are nearly even or slightly lower with their representation - I suspect this is partially due to very low numbers overall, but notice the one case this isn’t true - in young children - because they are a shorter temporal distance from that single dose.
All of this argues strongly for a negative overall effect from adding more doses against a wildly different strain of virus. Tie this to the Omicron specific test which showed fewer neutralizing antibodies than just dosing again and we start to see significant warning signs that OAS isn’t just possible, it really looks like it is happening. Only the short term boost of overall antibody levels immediately (14 days) afterwards has any protective ability.
I’m very interested in alternate explanations. These charts tied with the anecdotal reports of multiple infections in 3x vaccinated individuals are all pointing in the same direction. I hope you know I will give any alternatives you suggest a very fair hearing - but I don’t see how even previous infections being higher in less vaccinated cohorts helps with this. Even that (assuming the Not vaccinated have a very high prior-infection rate) doesn’t work because ONLY the Not vaccinated show universal under-representation. That certainly implies that vaccination has a deleterious effect on your future immunity even after infection (also borne out by the UK data with the Unvaccinated rates being lower than the 2 Dose rates, being lower than the 3 Dose rates.
I'm not sure the Walgreens data actually shows this. It's true that the positivity is skewed to the vaxxed but it doesn't account for possible bias in testing rate.
If you weight the positive cases by percent of overall population allegedly vaxxed, you find higher case rates in the unvaxxed (at least for the 45-64 age group - I didn't check the others).
Of course this is also invalid because what really matters is the proportion of vaxxed in the set of customers who go to walgreens for these sorts of things.
IMO this proves it neither way, but certainly does not lend credence to the idea that vaccination reduces case rate.
We made the right choice to stay away from the jabs so much is sure. Thanks for your work and I hope you recover quickly !