

Prior Infection and the Vaccinated
Answering my most common complaint

I’ve had several good questions asking if I can calculate the number of the Prior Infected amongst the vaccinated, with contentions that it isn’t fair to subtract the prior infected from the Unvaccinated but not the Vaccinated. This is not a bad question but here is my bullet pointed answer (which I will then go into detail on)
From Unvaccinated to Prior Infection is a change in immunity status - Antibodies vs No Antibodies. From Vaccinated to Vaccinated w/COVID Infection is not a change in antibody status.
The 18+ vaccinated (any number of shots) population, as a whole, is 4x the size of the unvaccinated population. In individual groups it gets relatively much smaller. As a result, the change in the case rates is drastically different.
hmmmm, I thought there were going to be more bullets.
Going Antibody Positive
I don’t think this argument is going to have many detractors. Let’s look at the question of just the Unvaccinated first. If you are unvaccinated, you are expected to have no immunity to COVID-19. But if you are in fact previously infected, you will have some immunity. Even those that clear COVID-19 without apparent antibody generation (primarily in the young - though this data is from early so I have no idea if it’s still good) have effective immunity because they cleared the virus. Something in their body protected them. From lack of any immunity to having immunity is a phase change. This effectively removes you from the unvaccinated category because you are now significantly more resistance to the virus than someone with a naive immune response.
Vaccination AND infection is a much more complicated discussion. We simply don’t know what we don’t know. Is it better to be infected then vaccinated? Vaccinated then infected? If you get one dose and then infected, do you need to get two, if you got infected and got one dose you aren’t considered 2 Dose vaccinated in this data. There are so many unknowns. And is the vaccine failing as badly as we suspect? I think the new PFE data clearly indicates the vaccines aren’t doing as well as they were. 95% increase in protection over 2 Dose vaccinated, but with a higher case rate than the original trials. The vaccines ARE failing. But that complicated this even more. If you were vaccinated in January and infected in June are you more or less immune than someone infected in January and vaccinated in June - or any combination thereof.
Basically, aside from the difficulty in backing out this number, there is so much we just don’t know about the vaccines by themselves, let alone how they interact with COVID infection. This is a major minefield. But it doesn’t matter.
Population Sizes
I can make a stab at determining prior-infections in the vaccinated. There are caveats though. From the Flu and COVID Report 41

N Antibody titers are fading faster and may disappear in those that are vaccinated and later get COVID-19. With that rather large caveat, I can estimate the number of vaccinated with COVID-19 infections.
First I calculate the S-Antibody population. For 80+ year-olds, this is 2,708,410. Then I subtract the Single dose vaccinated population in this age group (2,604,619) to get 103,793. This is the "Prior Immunity” population of the Unvaccinated 80+ age group. Now I calculate the N-Antibody population as 207,500 and subtract the 103,793 of the prior immunity out which leaves me with 103,706. Almost the exact same number as the entire Prior Immunity population. This is the number that can be in the vaccinated population (all levels of vaccination). The entire Unvaccinated population is 125,635 so the Prior Immunity portion is 103,793/125,635 or 82.6%. Now the 2 dose vaccinated population of 80+ is 2,568,761 (this is the more conservative number to use since the single dose population is larger). 103,706/2,568,761 is 4.04%. That’s over 20X smaller percentage-wise. If I subtract this from the denominator and recalculate the case rate, it goes from 406.77 to 423.89 and increase of just over 4%. But if I remove the Prior Immunity population from the Unvaccinated Population, the case rate goes from 304.1 to 1,748.9 or 475% more (more than 100X the difference of the Vaccinated change). (This isn’t a correct case rate as I discuss in Part 2 and Part 3, but it proves the point)
Remembering the above caveats, if I do this same math in all the age groups, I get this chart.

In the youngest two age groups, I don’t assign any N Antibodies to the vaccinated group because the Prior-Immune group can consume them all, this is likely incorrect, possibly due to them clearing COVID-19 more easily and not generating many if any N Antibodies in the process, so I will spot them 4% as a floor. But even were I to take a blanket 10% haircut off of the Vaccinated population to account for a generous over-estimate of prior infections, the size differential would swamp any effect. The change in the vaccinated rate would be about 11%. Meanwhile in an Unvaccinated population reduced by 90%, the case rate would increase 10X.

Obviously the situation is worse the bigger the differential in population size. But interestingly the 30-39 year-old age group’s case rate just fell below the fully vaccinated rate and the 18-29 year-old rate is just above the vaccinated rate. It is possible that 2 is an important threshold for relative population size. (It’s also entirely possible that is just a red herring.)
So what does this all mean
While it is fair to want to reduce the Vaccinated denominator, go ahead and issue an across the board 11% increase in case rates there if you want. That’s about the level of impact you should expect. And think about how you might explain this:
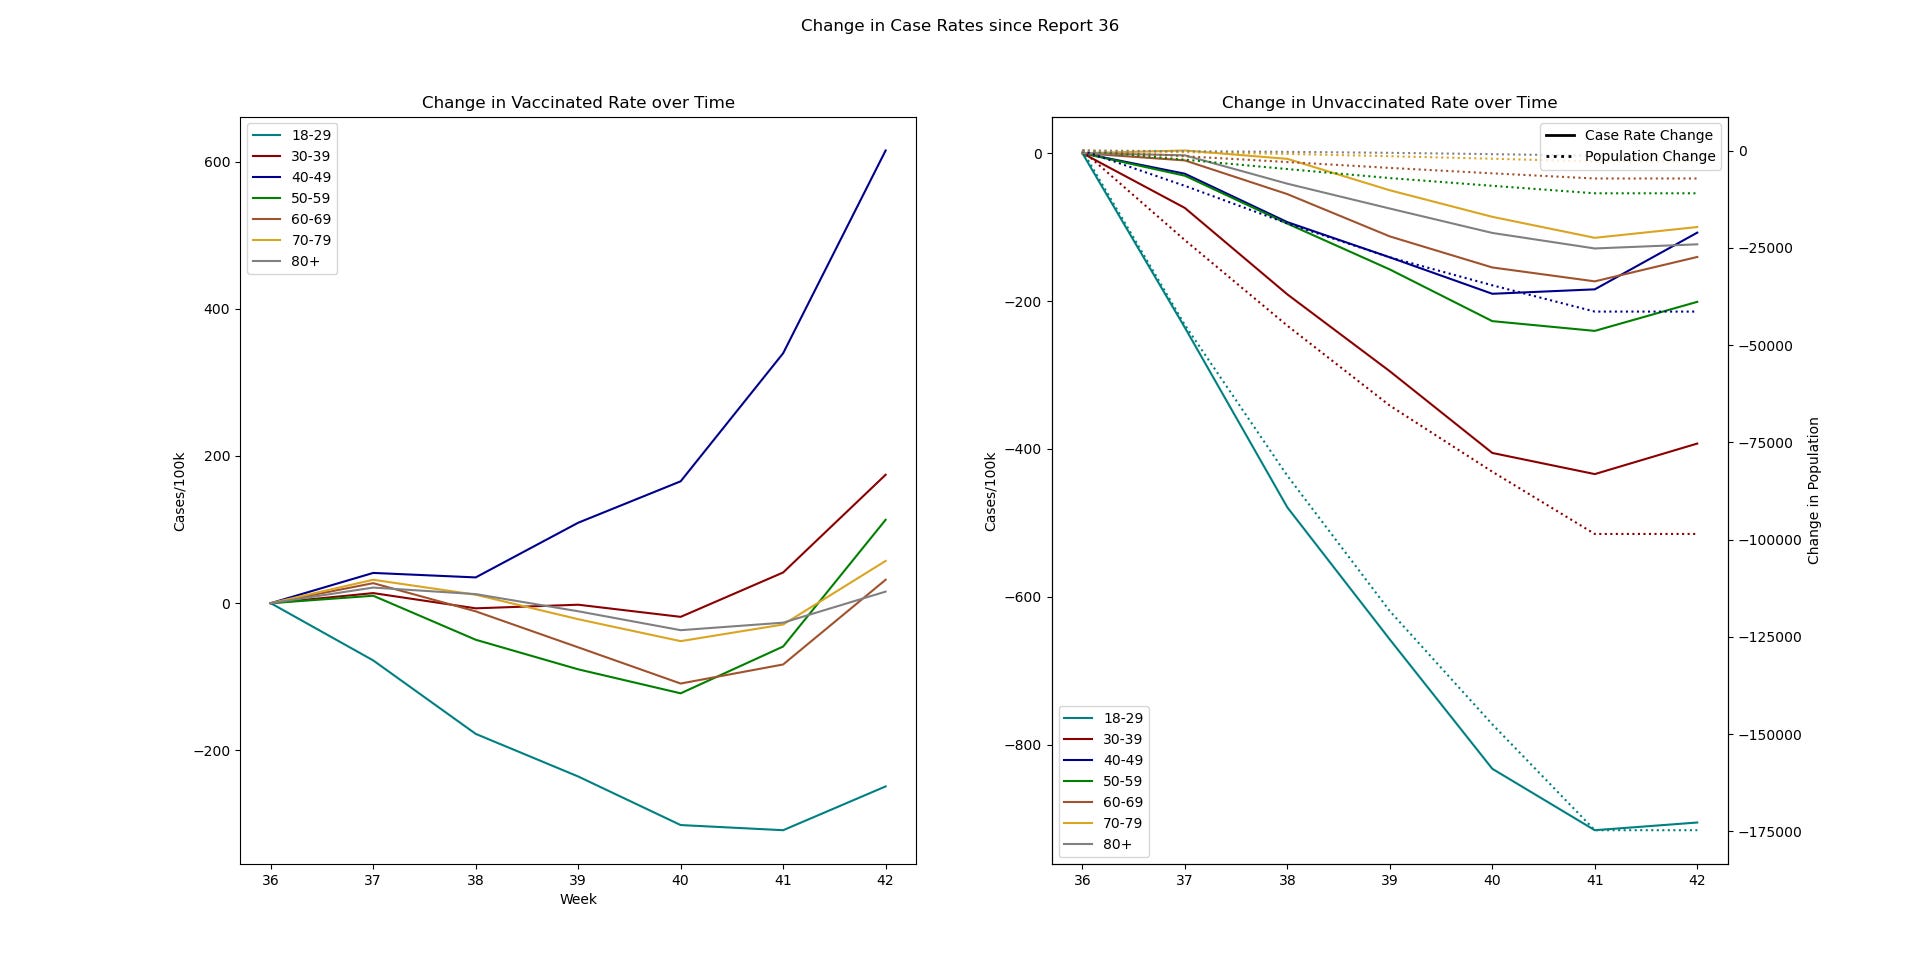
For these charts, I subtracted the case rate from Week 36 from both the vaccinated and unvaccinated columns so you can see the change in case rate since then. The vaccinated is more mixed, kind of neutral with only the 18-29 year-old cohort showing a real drop. Most were more neutral with the 40-49 year-old cohort showing a very significant increase. For the Unvaccinated, the growth is entirely down (until the report that came out today) but even with that report, they are still all negative since Report 36. But the interesting thing is that I also graphed the change in population minus the population starting Week 36.
Now I know your first thought is this: That’s just the way the graph scaled things and correlation does not equal causation. And I thought that too. And only 3 of the lines on the right seem to be correlated anyhow right? But then I realized that this should be anti-correlated. On the left, the population graph shows the populations going up and the one that goes up the most (18-29) shows the biggest case rate drop (the only drop for the whole time period). That should be expected. If vaccination works - especially at first, then adding new fully vaccinated people to a population should drop the case rate. But SUBTRACTING people from a group should not change the case rate, if anything, the smaller denominator should make it go up marginally. But if there isn’t any change to the immunological nature of that group - it wouldn’t affect the case rates meaningfully. They would after all be exactly as susceptible as before. There could be some drop if the overall cases were falling, but we would see that on both charts and we don’t. It would ONLY reduce the case rate if it was subtracting non-immune population almost exclusively and skewing the ratio of Prior Immunity to Non-Immunity even further, because in that case, the relative immunity of the group would be changing to be more immune overall.
I’m sure this isn’t the last word, but I hope this helps answer this common (and good) question.