


For the second time since I started this Substack, the UK Vaccine Surveillance Report has changed the week after I made particular comments.
The first time was right after my original post on the nature of the Unvaccinated Cohort. They added text in the report specifically addressing the possibility that previously infected might be in the unvaccinated cohort and that their “recent” infection might provide “a few weeks” of protection from reinfection.
Now, after spotting bad data in the first report and then realizing it is in fact the 2 Dose column minus the Boosted column and complaining about the lack of a proper 3 Dose column, they provide!

The numbers in the Second Dose >= 14 days before specimen date column match up well with the numbers I used to calculate the separate 2 Dose and 3 Dose rates.
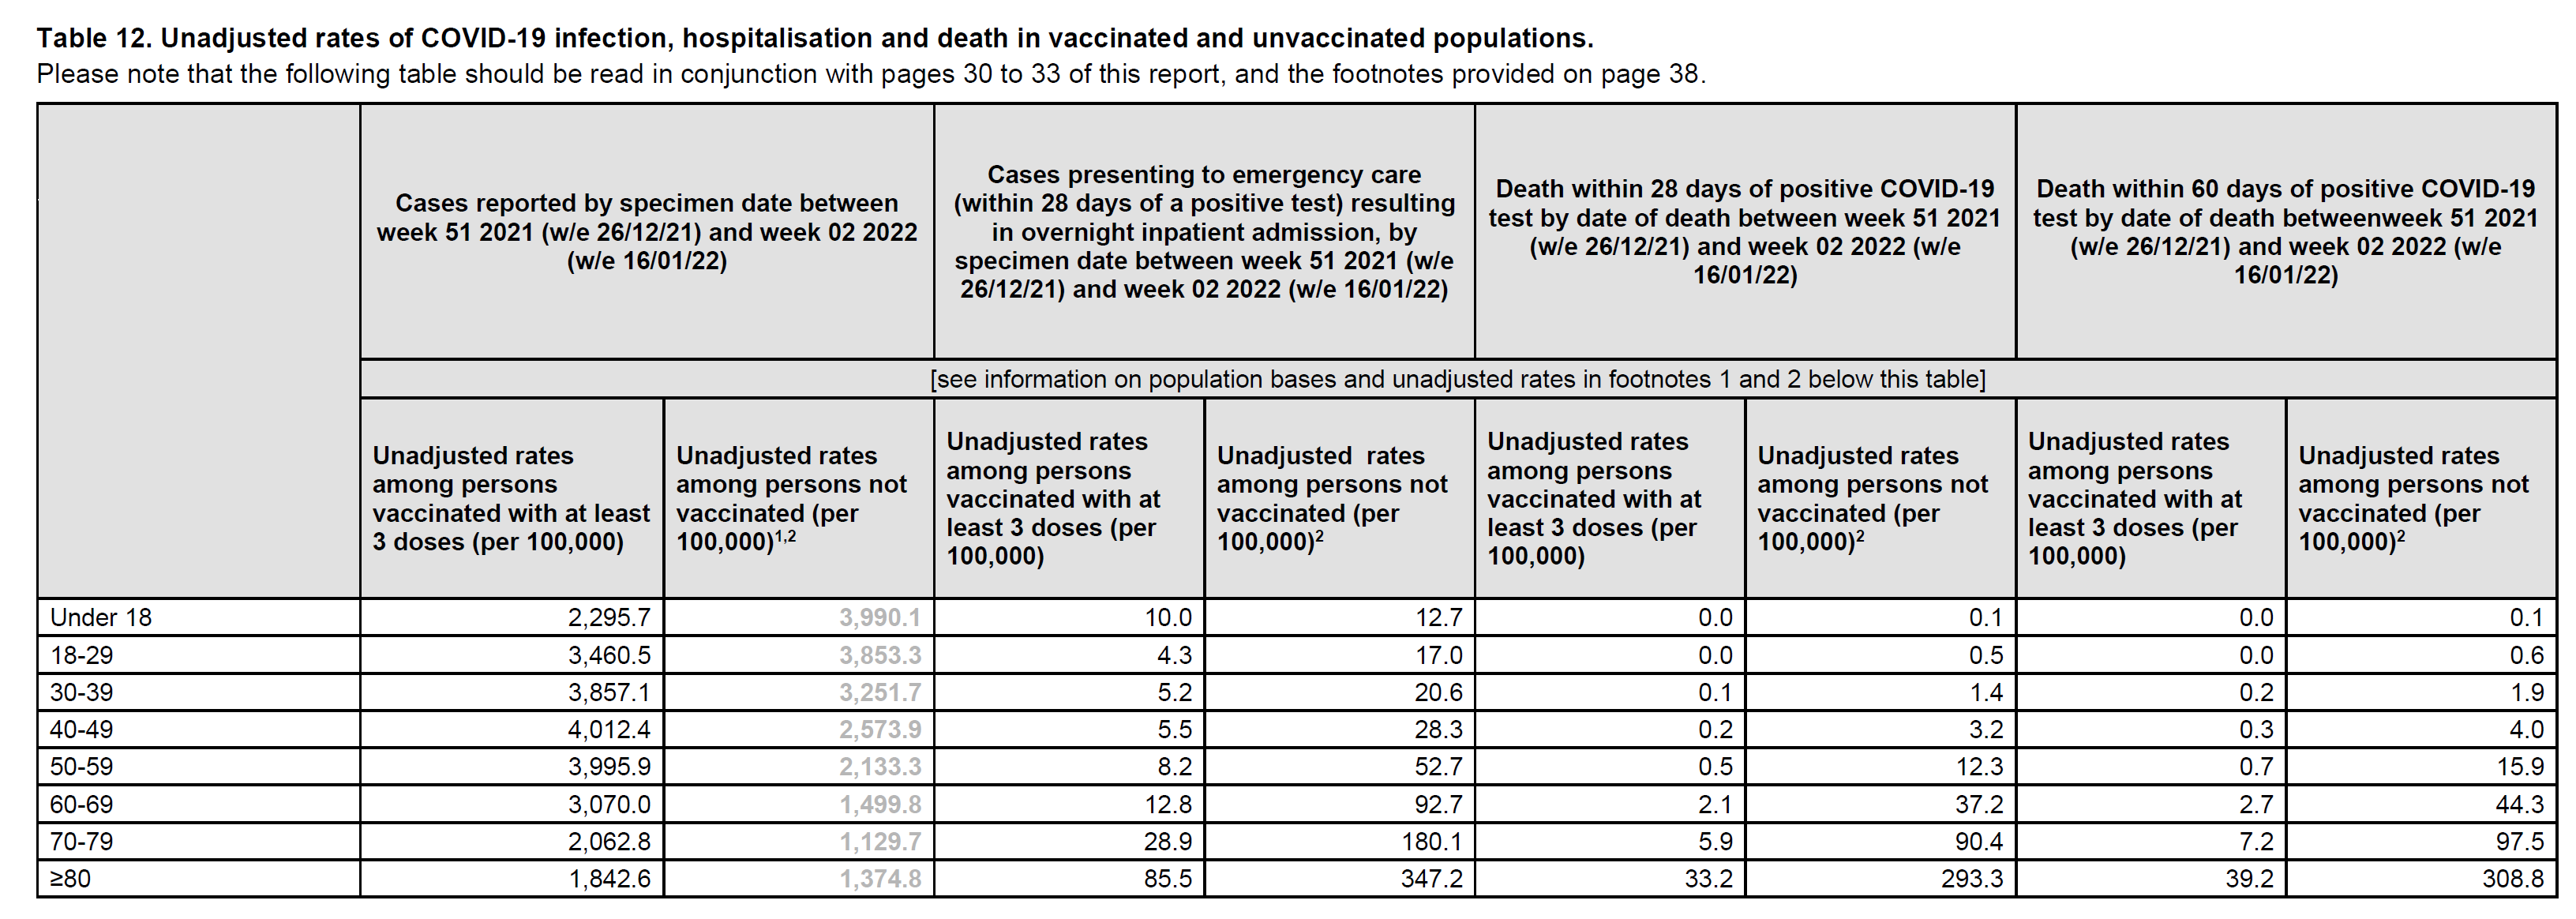
Unfortunately, the column here is labelled “…at least 3 doses…”. At first I thought this was an error and it meant at least 2 doses which would be the number they have been reporting up until now. The “at least” wording made it seem likely. But no, this is actually only the boosted rate. This allows them to show much lower vaccinated rates. In fact, boosted rates appear to have actual VE vs Unvaccinated 18-29 year-olds, though they are still CLEARLY higher in other ages. Even boosted doesn’t show efficacy against the “Unvaccinated” column, which as a reminder, is only partially non-immune (the magnitude of that non-immunity is not totally clear, but 50%+ seems a given at this point. So we are seeing that prior infection still outperforms vaccination even for Omicron which is more transmissible among the previously infected.
So they are playing games to improve their case rates (using the absolute lowed bar on the chart), but now that I have separate columns and updated vaccination numbers, I can calculate the proper rates per category. (And I consider it confirmed that I was right last week in how I calculated).
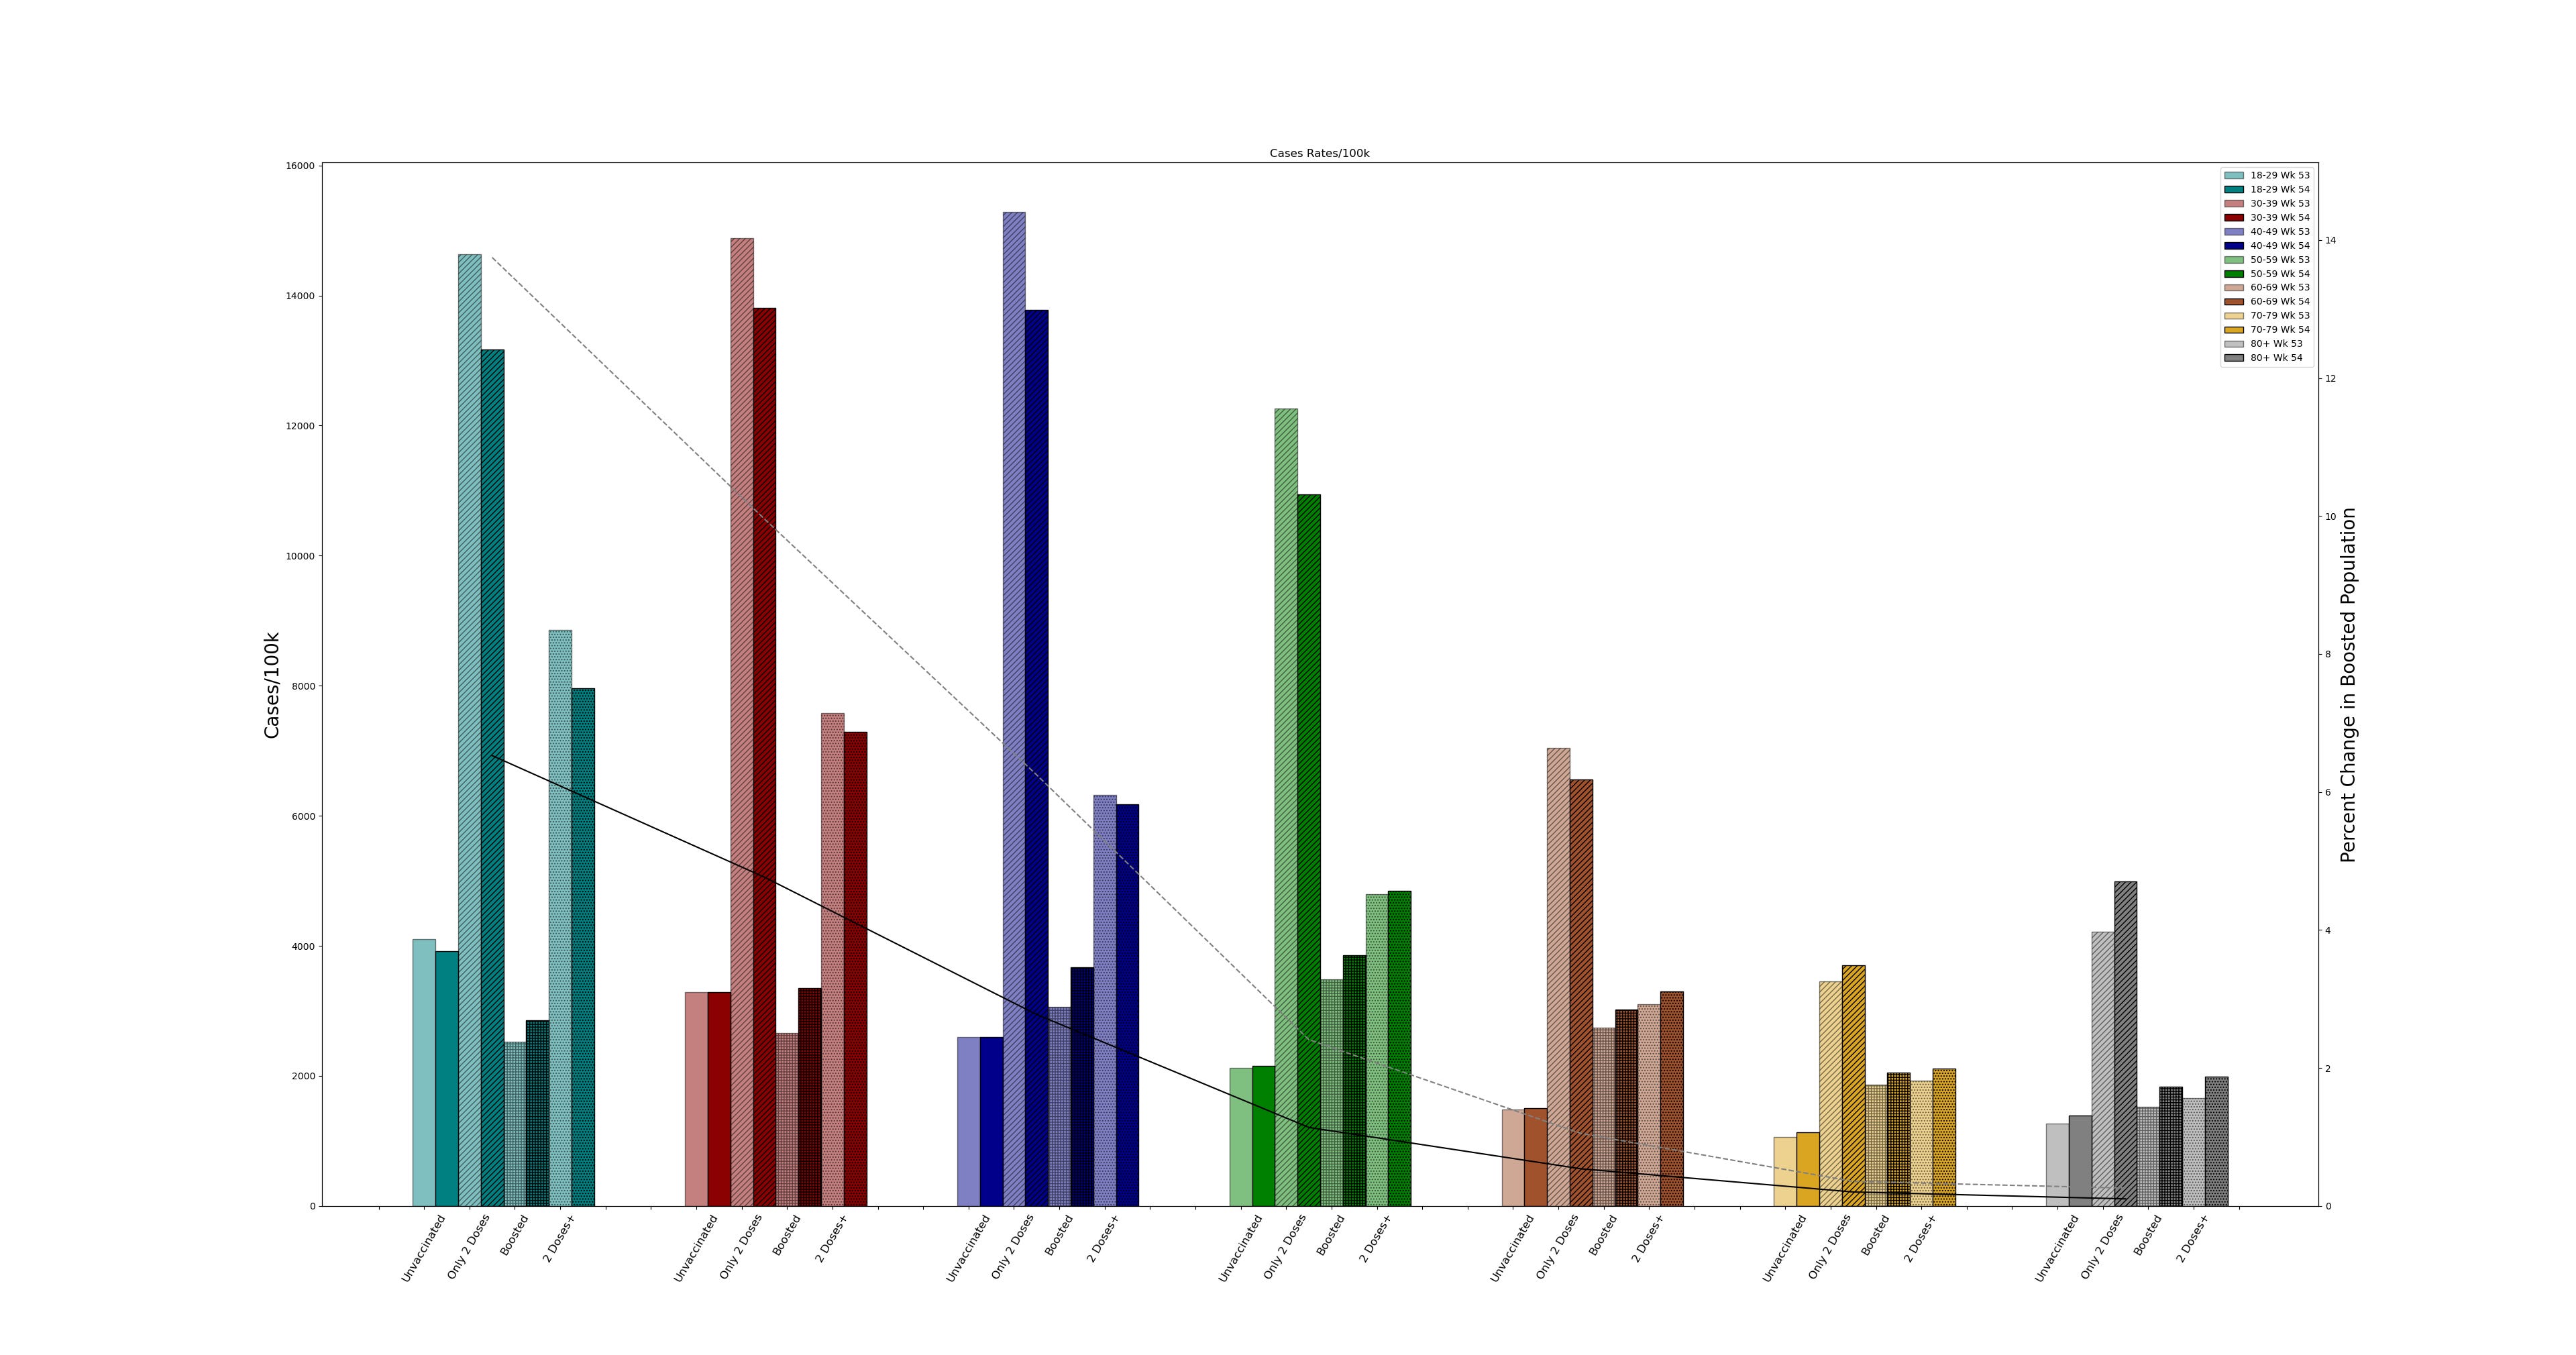
This chart shows you the changes since last week. I also overlaid lines representing the percent change in the boosted population since the previous week. The higher this rate is, the more Immortal Time Bias affects the 2 Dose rate. I suspect most of the 2 Dose rate here is being driven by the relatively high booster update in the younger age cohorts. As the line flattens off, there is much less effect on the 2 Dose cohort. And the rate of boosting has dropped nearly in half in the younger age cohorts which similarly drops the 2 Dose case rate.
Notice that while the 2 Dose rate has dropped, the Boosted rate has gone up for all ages (the overall rate has fallen under 50 since the large 2 Dose drop dominates the average until the clear majority are boosted in the 50+ ages. Effectively that drop is weighted more heavily in younger ages) As we reach 70+, the rate of increase in boosting is very low and we see something much closer to a true 2 Dose rate which we can see has increased.
I do suspect this will be the last week of increase. The rate has been slowing for some time, Omicron is clearly peaking and given the windowed nature of our data, I expect the next week (this week) to be down moderately and push numbers down.
Admissions and Mortality though look a little different.
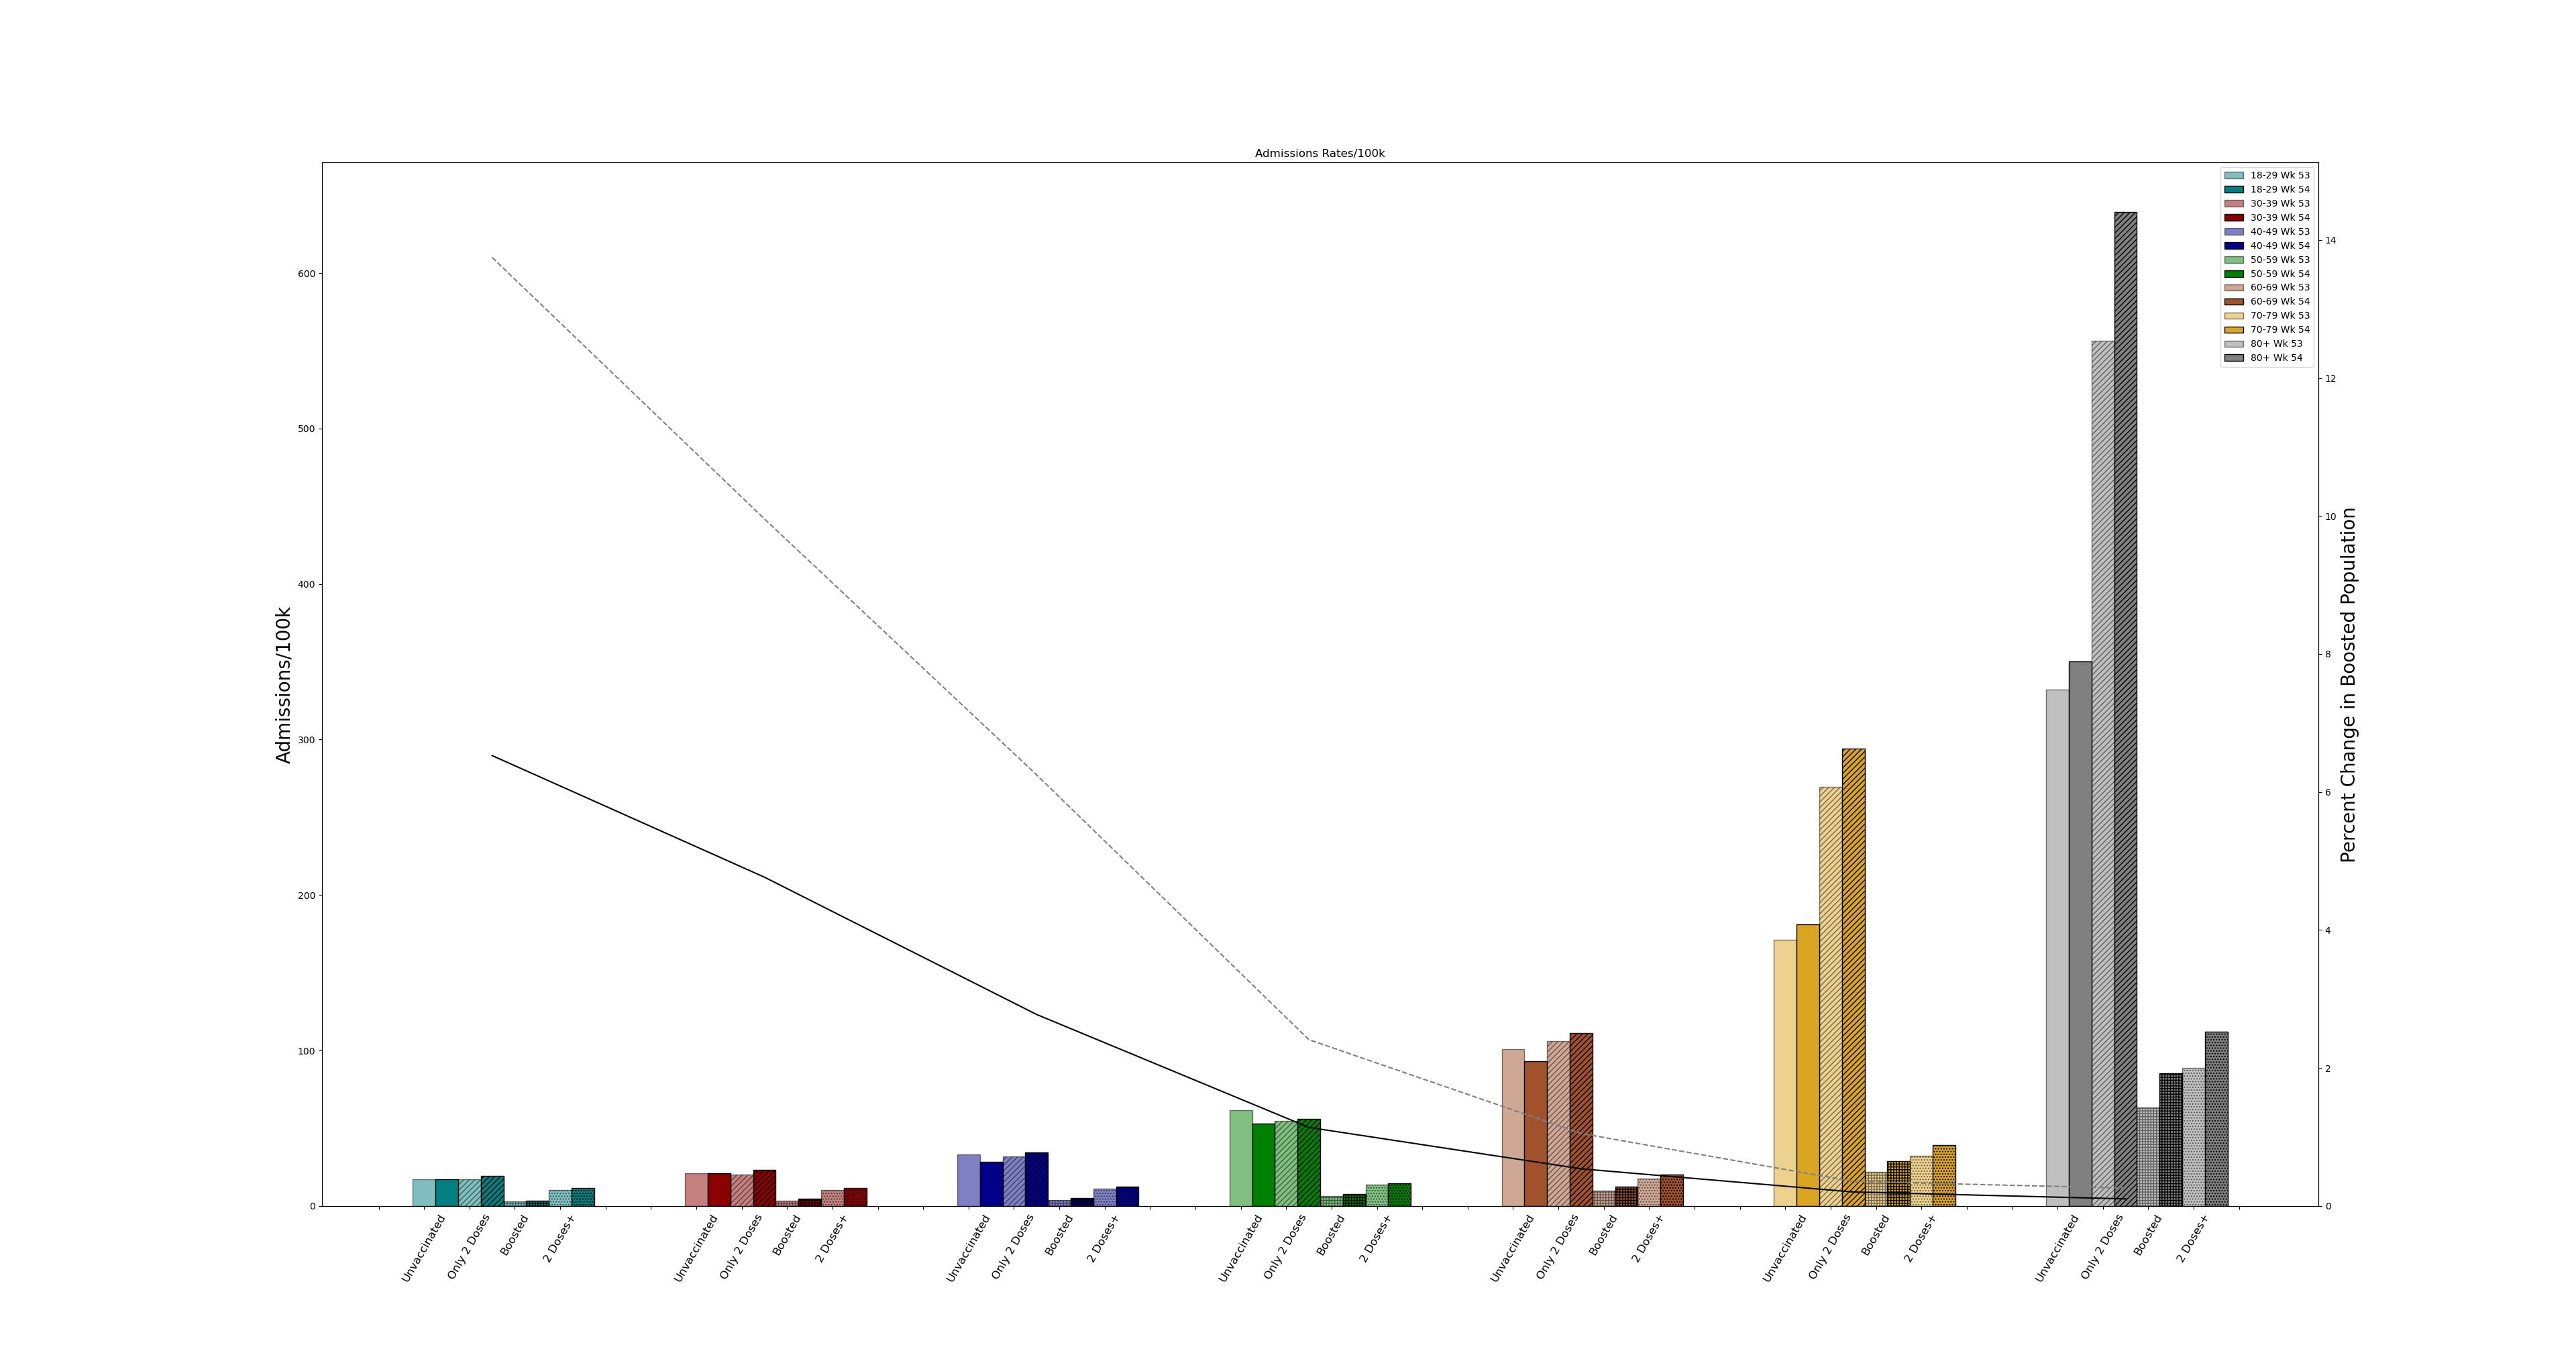
While cases are clearly being driven by boosting, admissions are lagging cases. They are up across the board. (Except for unvaccinated 40-69 year-olds.) Notice the rather large increase in the 80+ age cohort. Exactly who we don’t want increasing.
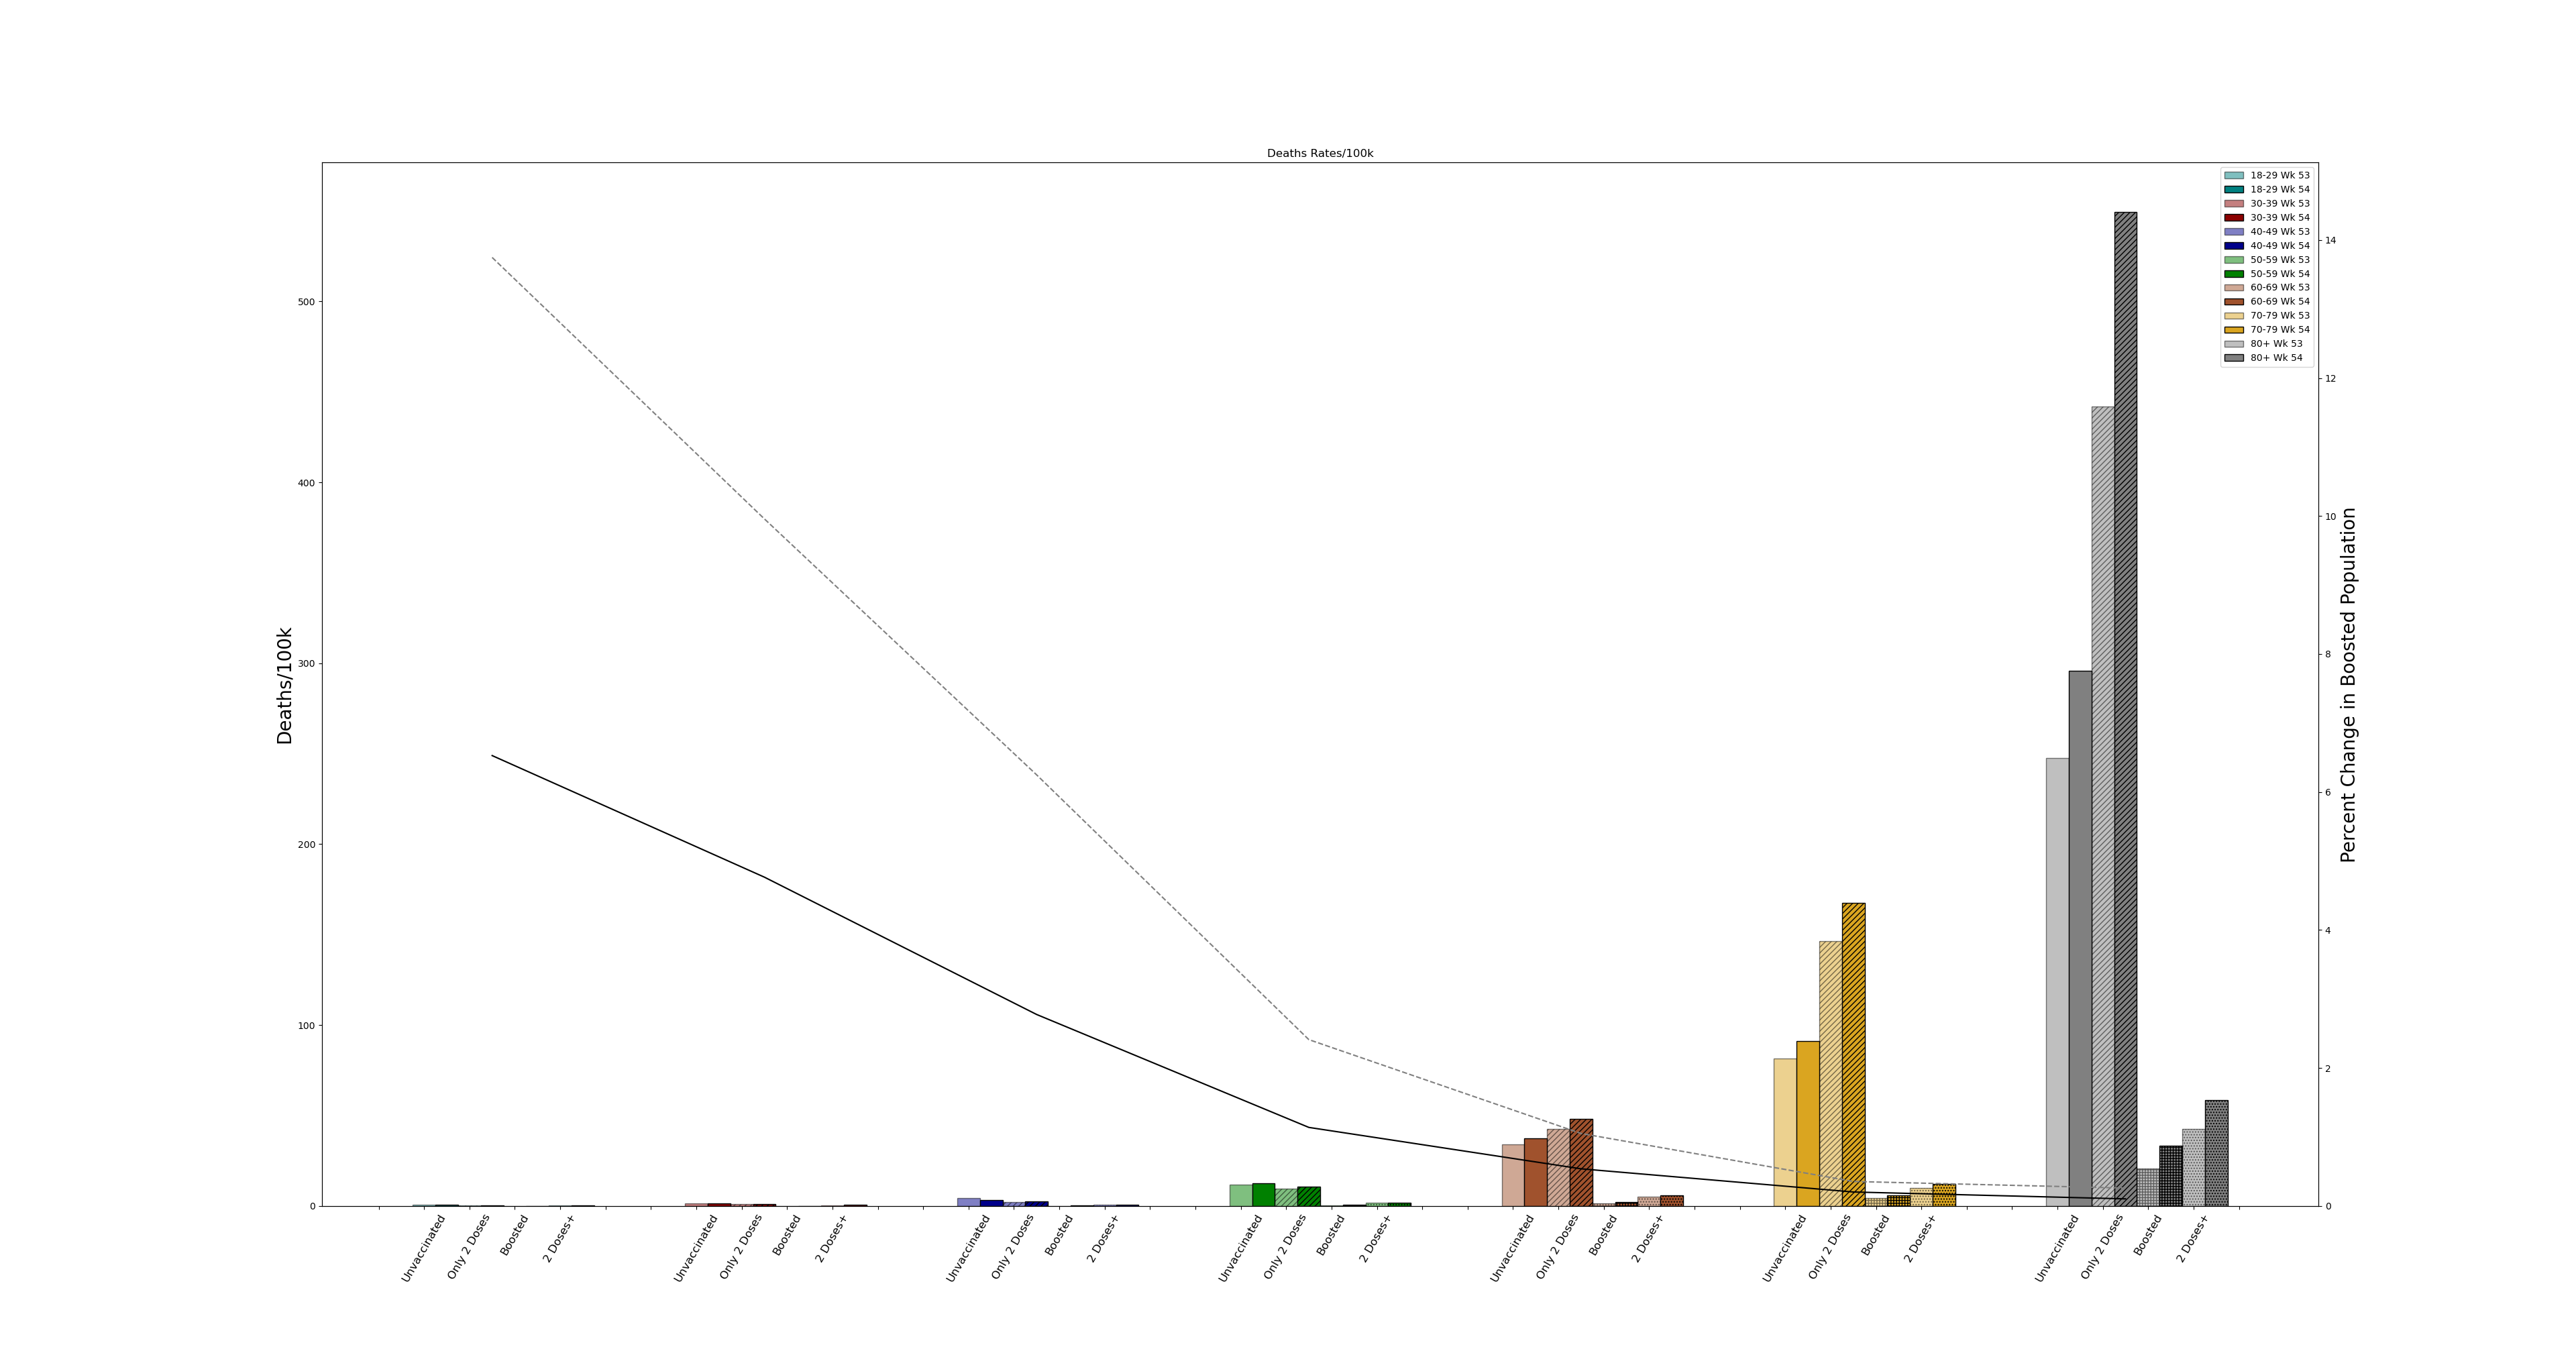
Mortality is more of the same, just a steeper log curve. So steep you can’t even see any bars under 40.
So the takeaways here are primarily that I’m seeing strong evidence that rate of boosting has a large effect on 2 Dose case rates. It has a lot less effect on admissions and mortality because the log risk by age swamps any visible effect. Moreover, the lag in admissions/mortality also mean we need to look at earlier rates to have any idea what the real change is. Hospitalization now was driven by cases 1-2 weeks back in most cases.
I might take a stab and quantifying the effect on percent change in boosters with cases, but I’m going to leave that for another time. Looks like things continue apace and the worst results are in the oldest cohorts while the UK HSA attempts to hide 2 Dose VE behind boosters.
Thanks for this, top-notch analysis.
It couldn't be more obvious that, as you say, they are hiding the dose 2 failure behind the boosters.
FWIW, here is my take on the same report: https://noline.substack.com/p/ukhsa-week-2022-03/comments. I will be using your comment on eugyppius's write-up to improve the next ones.